Capabilities
Built around speed, curated lists, rich context, and relative strength.
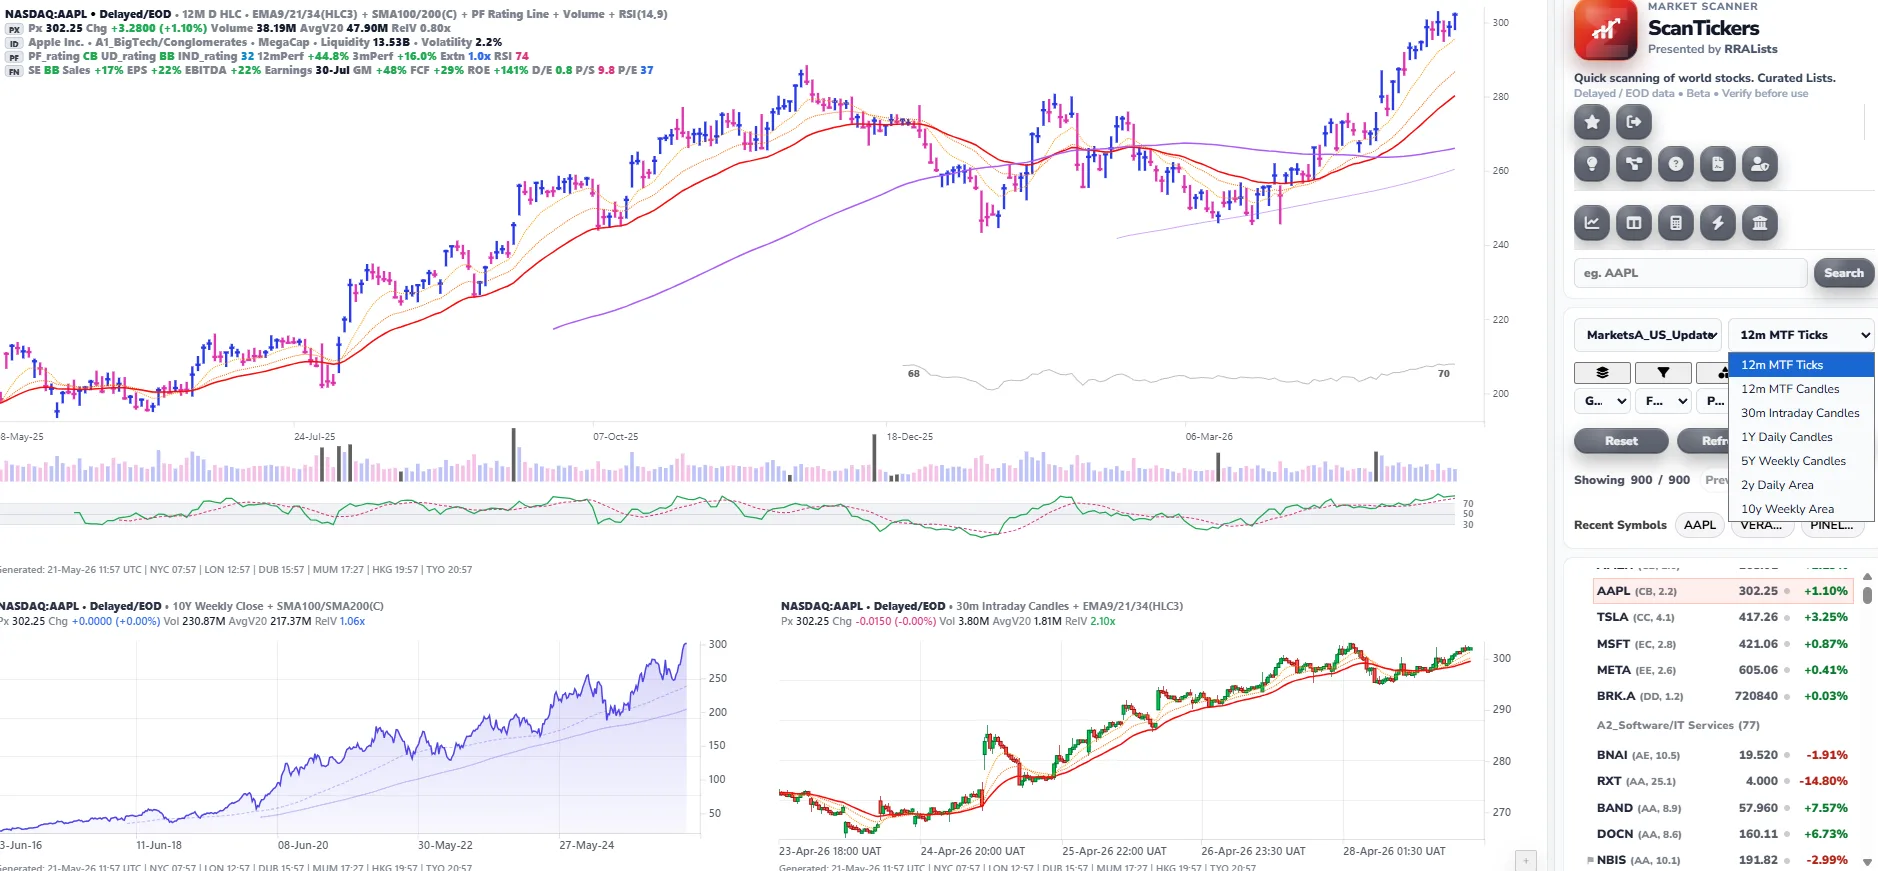
The core workflow is simple: start with curated global watchlists, scan quickly across multiple timeframes,
read performance/earnings/growth context directly on the charts, then use relative strength, breadth,
options activity, and regime context to refine what deserves attention.
01
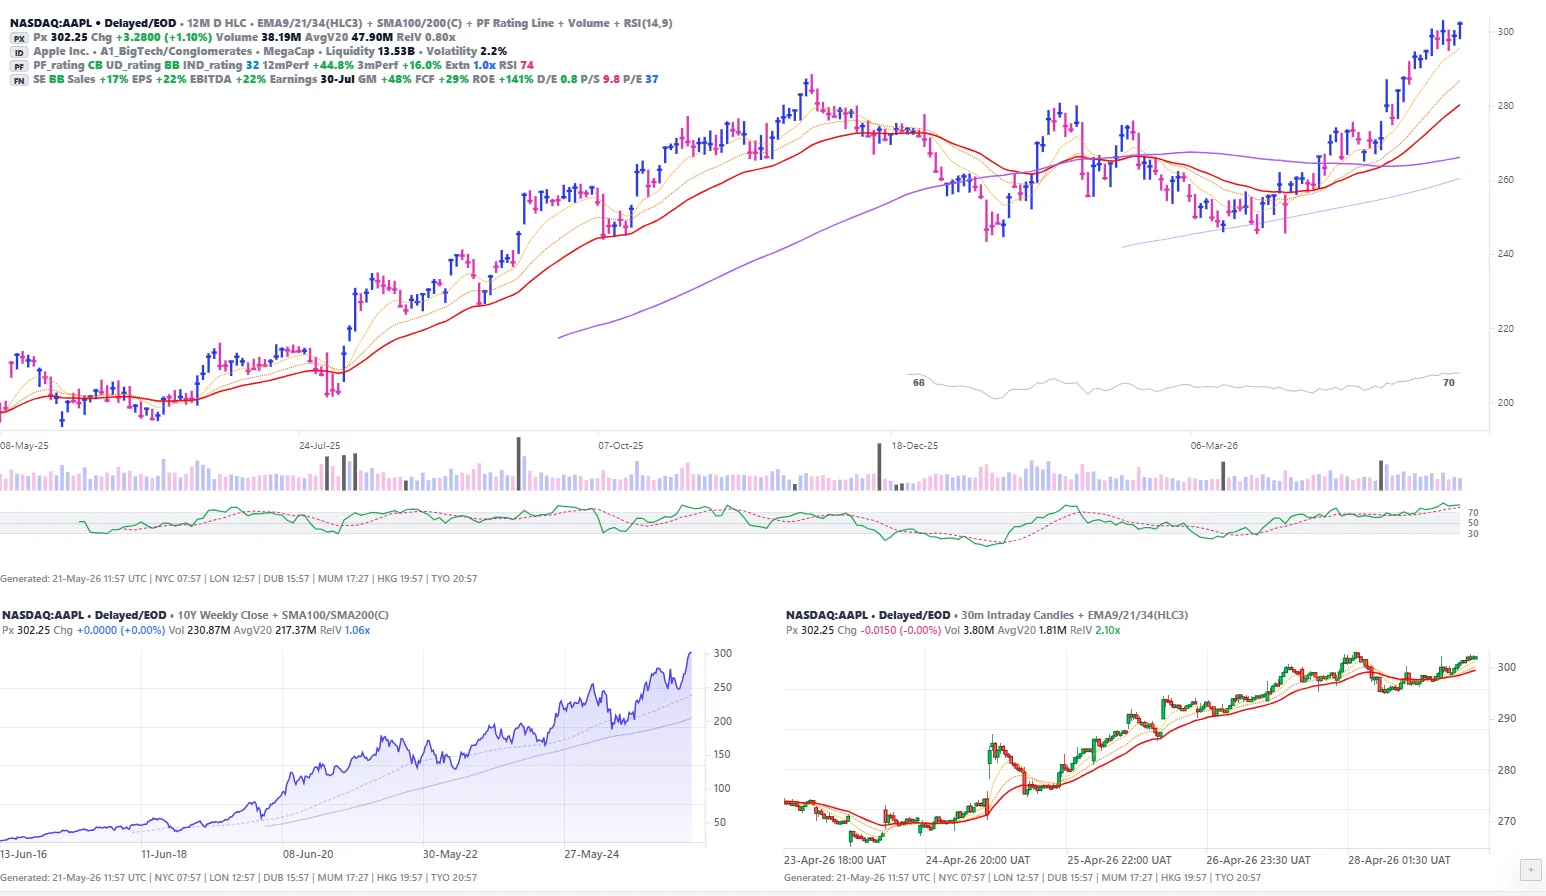
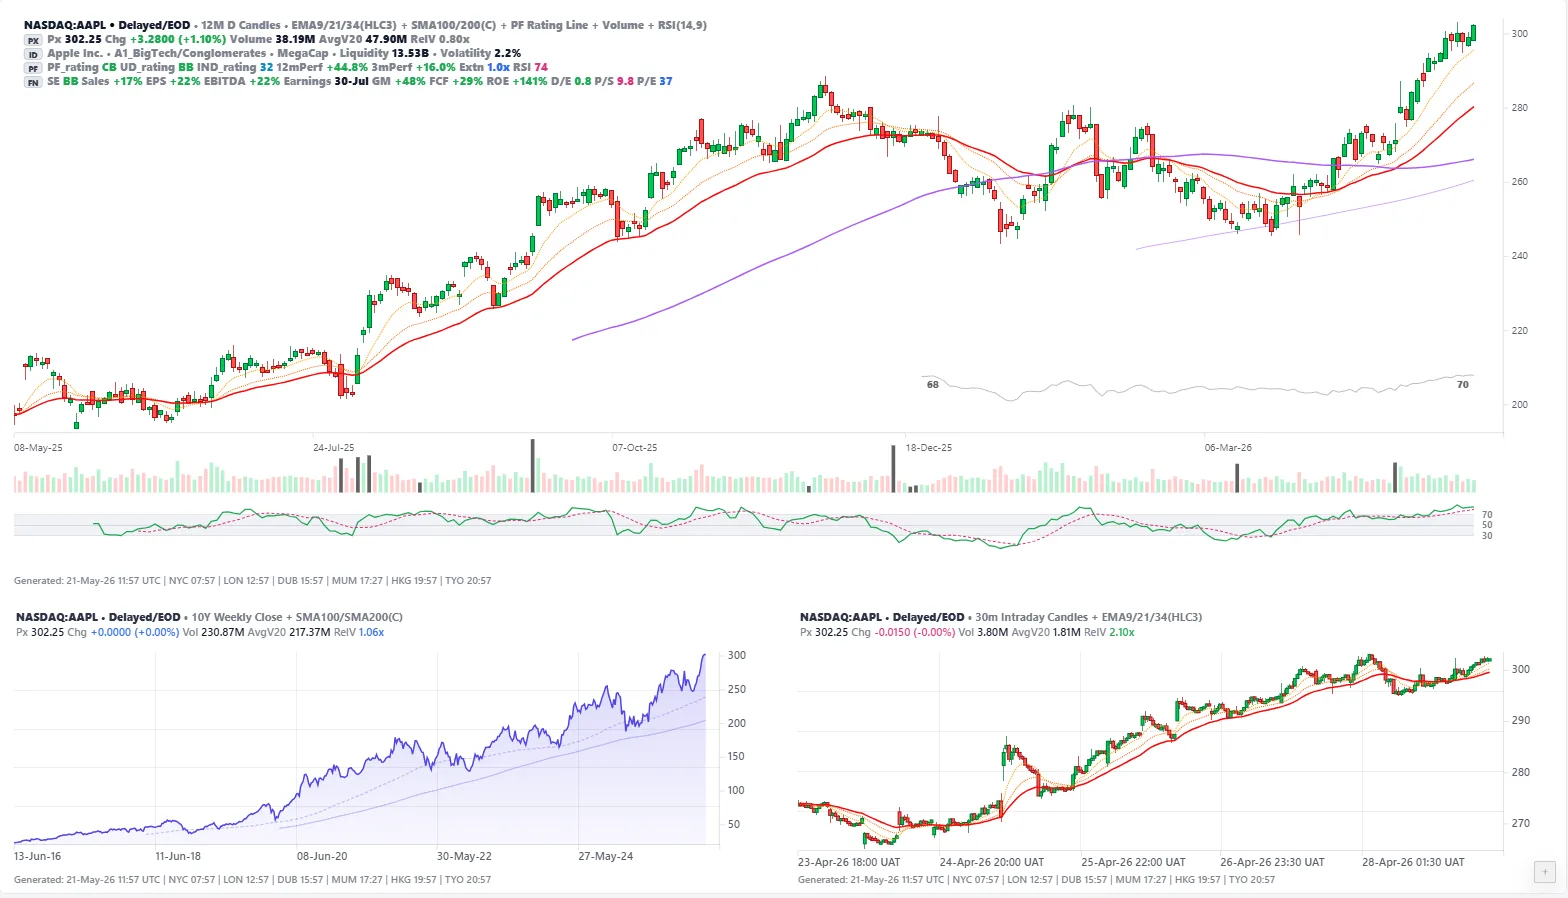
Ultra-Fast MTF Scanning
Rapidly review the same ticker across intraday, daily, weekly, and long-term chart views without rebuilding charts manually.
02
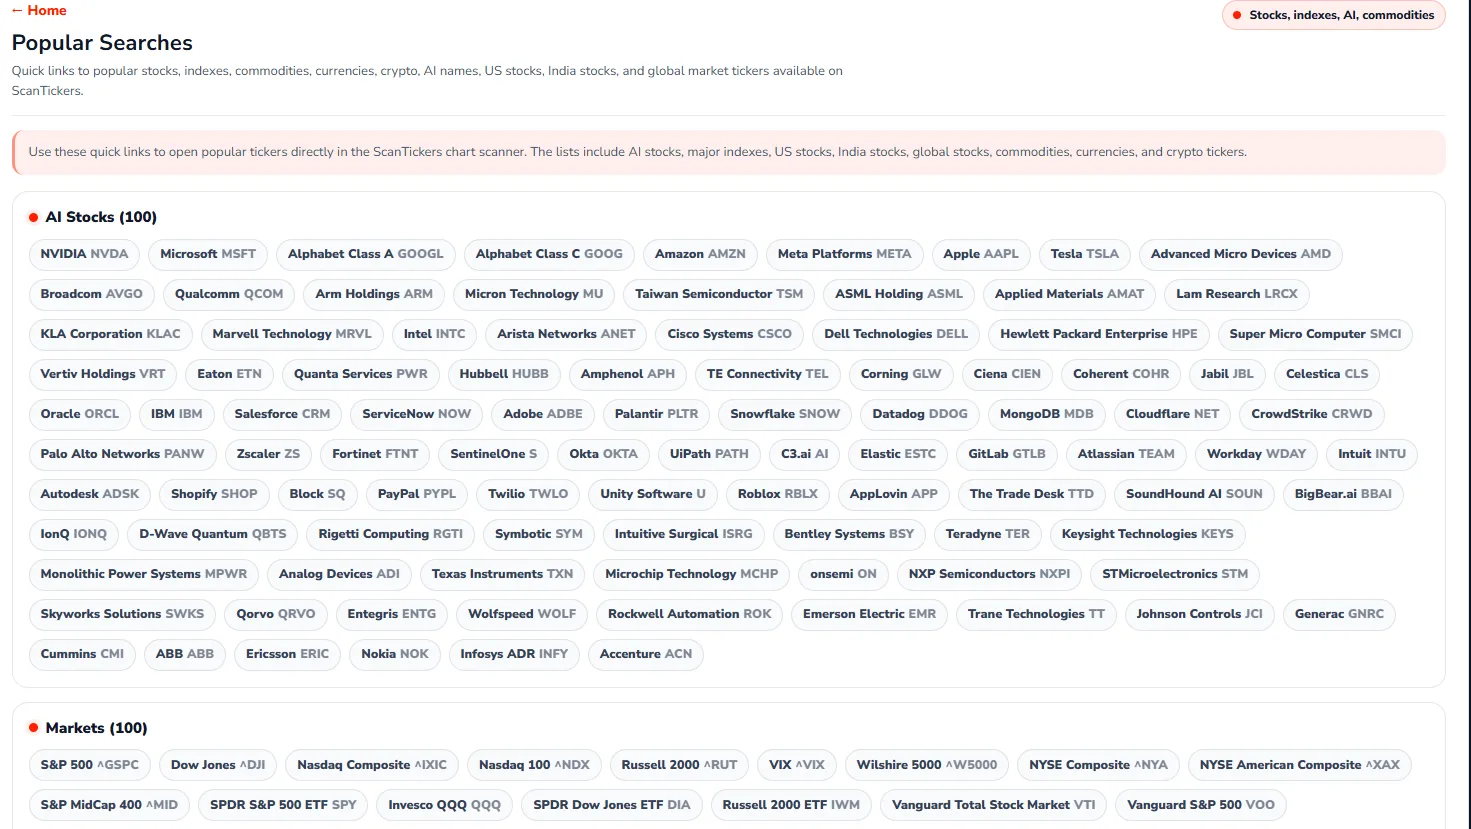
Curated Global Watchlists
Major global markets are organized into cleaner watchlists based on liquidity, performance, and market relevance.
03
Performance + Earnings Context
Important performance, earnings, growth, liquidity, quality, volume, volatility, and rating data is visible directly on chart panels.
04
Custom Relative Strength Line
A performance / relative-strength style line helps compare leadership, lagging behavior, and trend persistence across stocks and markets.
05
10,000+ Charts Processed
Large-scale chart generation across global equities, indices, ETFs, futures, and selected market instruments.
06
Options-Volume Screens
Dedicated views for names showing elevated options-volume activity.
07
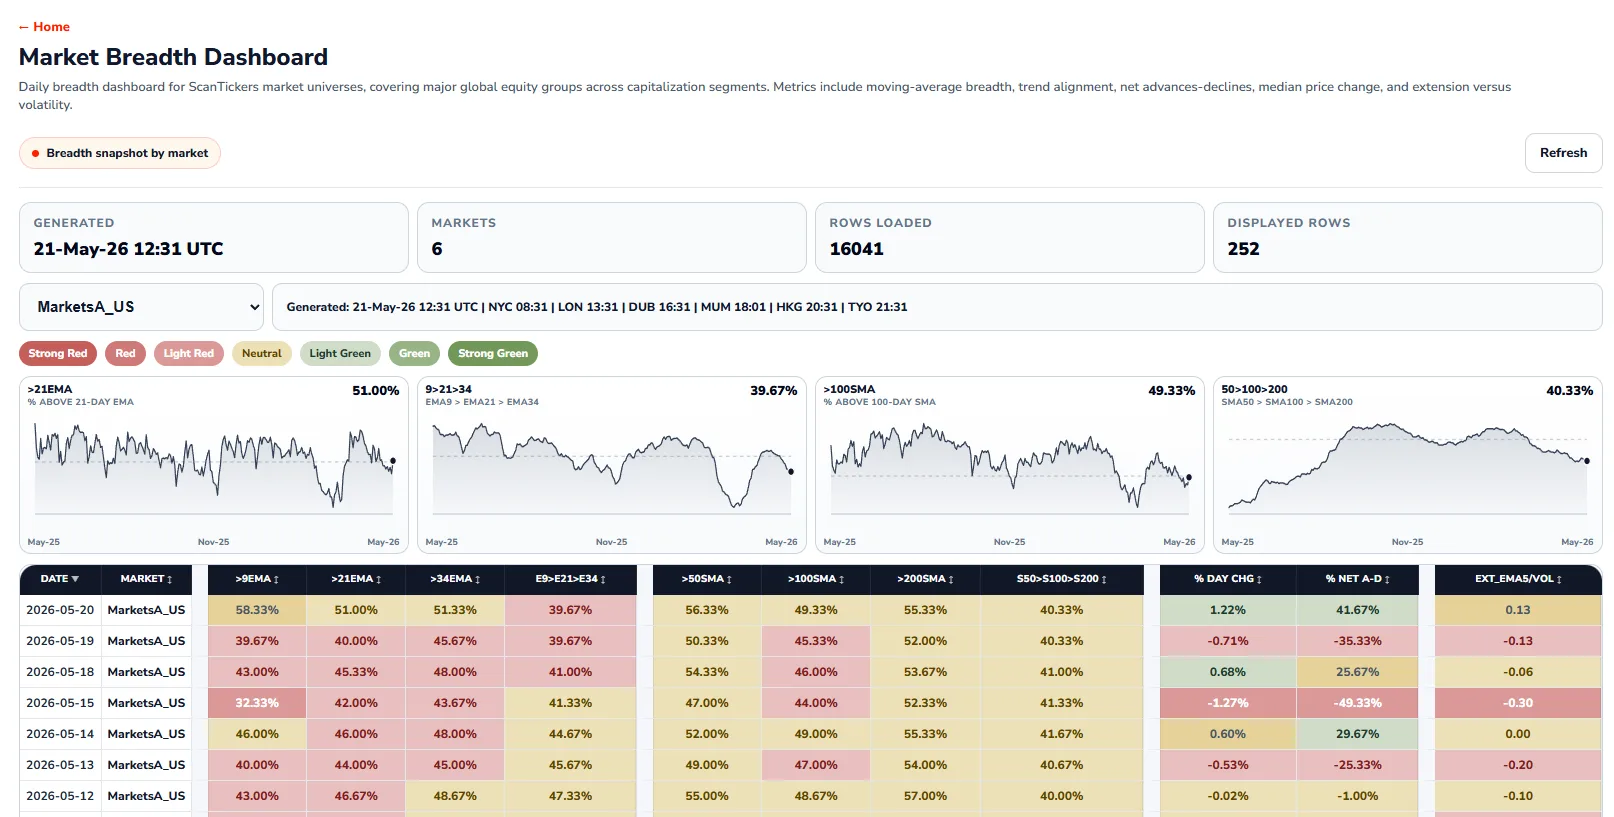
Market Breadth
Moving-average breadth, trend alignment, net advances/declines, median change, and extension metrics.
08
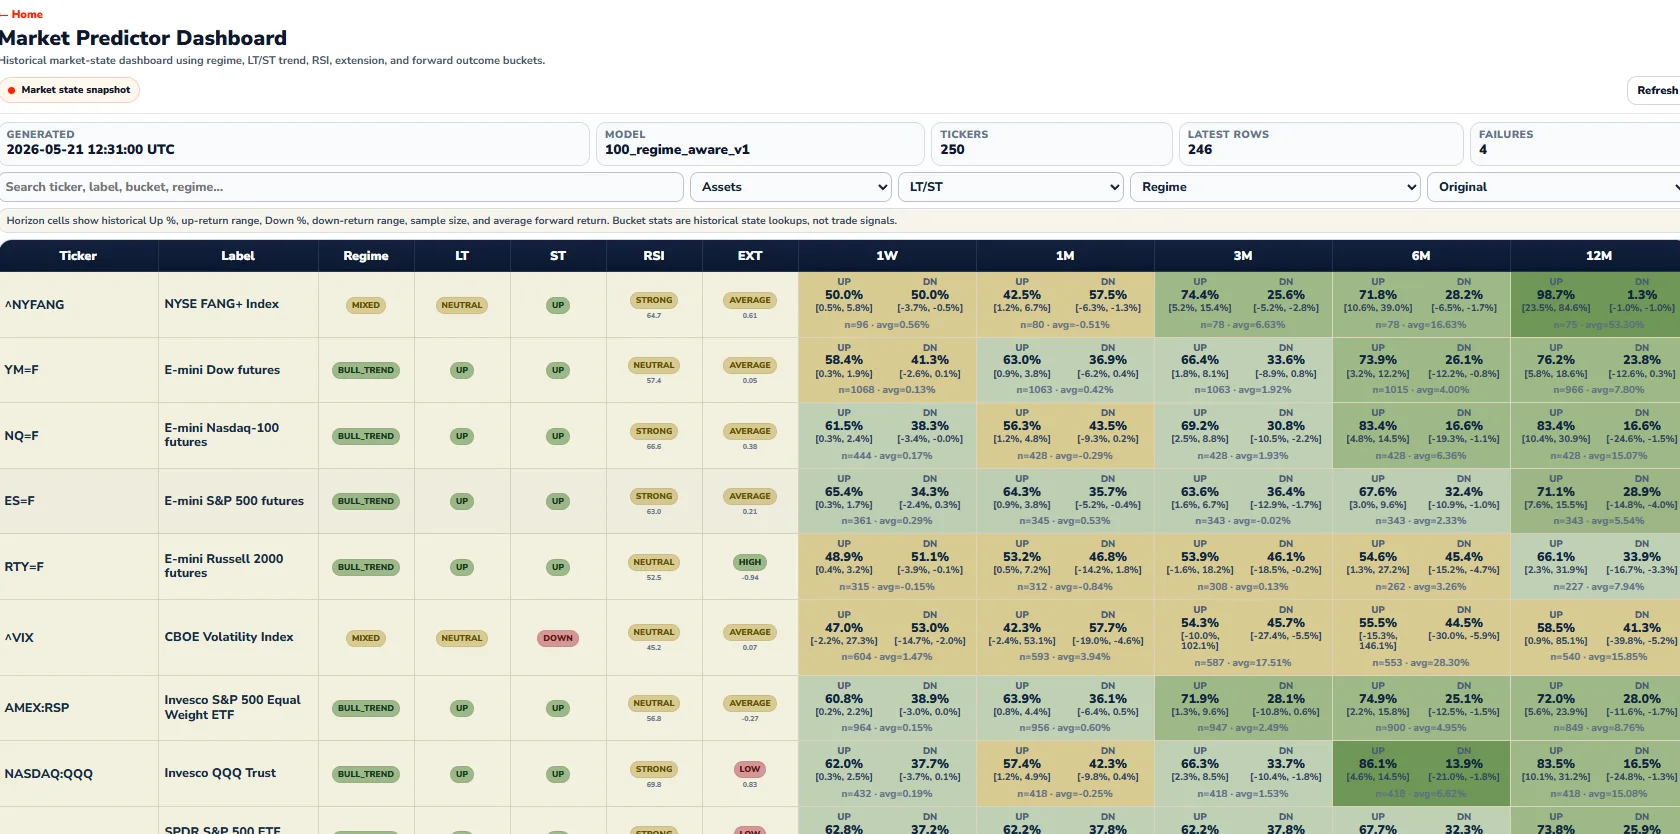
Backtested Predictor
Historical regime dashboard using trend, RSI, extension, and forward-outcome buckets.